

Introduction to Sigma Standard Deviation
Have you ever looked at numbers and wondered what they really mean? Maybe test scores, sales numbers, or daily temperatures. Numbers tell stories, but we need tools to understand them. One powerful tool is sigma standard deviation. It may sound complex, but it simply shows how spread out numbers are. When numbers stay close together, the spread is small. When numbers are far apart, the spread is large. I have worked with data in classrooms and business reports, and I can tell you this concept becomes simple once you see it in action. In this guide, I will explain sigma standard deviation in clear language, using real-life examples you can easily understand and apply.
What Does Sigma Mean?
Sigma is a Greek letter written as σ. In statistics, it represents standard deviation. When people say sigma standard deviation, they are talking about how much numbers move away from the average.You can picture it as a way to measure how far numbers wander from the average.
Picture this: you and your friends just finished a math test and are waiting to see your scores.If most values sit close to the average, the sigma standard deviation is small. If values are spread far apart, it is larger. This idea helps us see whether results are consistent or unpredictable. I remember first hearing the word “sigma” in a math class and feeling nervous. Later, I realized it was just a simple way to measure spread, not something scary at all.
Understanding the Average First
Before we understand sigma standard deviation, we must understand the average, also called the mean. The average is the center point of a group of numbers. You find it by adding all numbers and dividing by how many there are. Once you know the average, you can see how far each number is from that center. That distance is the key idea behind standard deviation. Without the average, there is nothing to compare. In real life, I always start with the mean when reviewing reports. It gives me a clear starting point before I look at variation.
How Sigma Standard Deviation Measures Spread
Sigma standard deviation measures how much numbers differ from the average. Think about a day when you and your friends complete a math test and later compare your scores.
If everyone scores between 80 and 85, the scores are close together. The sigma standard deviation is small. If some students score 50 and others score 100, the scores are spread out. The sigma standard deviation becomes larger. It works like measuring how tightly grouped or scattered values are. This helps us understand consistency. When I analyze performance data, I often look at spread first. It quickly tells me if results are stable or uneven.
The Bell Curve and Normal Distribution
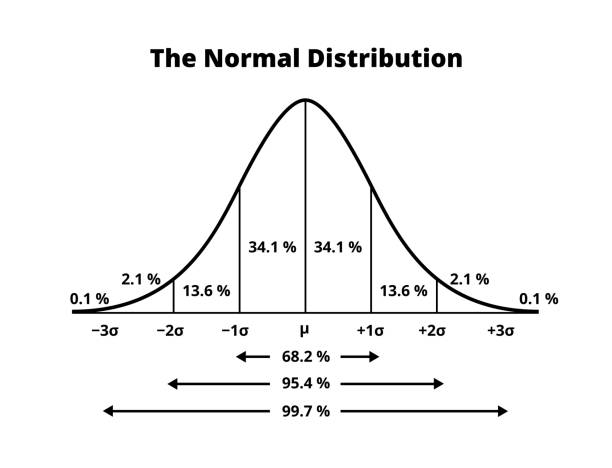
Many times, data forms a bell-shaped pattern called normal distribution. In this shape, most values sit near the average, and fewer values sit at the extremes. Sigma standard deviation plays a big role here.In a normal pattern, around 68% of the numbers sit within one standard deviation of the average.
Around 95% fall within two. Nearly all values fall within three. People often call this pattern the 68-95-99.7 rule because of how data spreads around the average.When I first saw this rule, I found it amazing how predictable many natural patterns are. Test scores, heights, and reaction times often follow this curve.
Real-Life Example: School Test Scores
Let’s take a simple example from school. Imagine a class of students takes a science exam. The average score is 75. If most students score between 70 and 80, the sigma standard deviation is low. That means performance is consistent. If scores range from 40 to 100, the variation is large. Teachers can use this information to see if a test was fair or too difficult. I once helped review student results for a small workshop. Seeing the spread helped us adjust the next lesson plan. Sigma standard deviation made the improvement clear and practical.
Sigma Standard Deviation in Business
Businesses rely heavily on sigma standard deviation. Companies want products to be consistent. If a factory produces bottles, each bottle should be almost the same size. If sizes vary too much, customers may complain. A low sigma standard deviation means high quality and less variation. Many companies follow quality improvement systems like Six Sigma to reduce defects. I once visited a production facility where managers tracked variation daily. Their focus on controlling spread helped reduce waste and improve customer satisfaction. That experience showed me how powerful this measurement can be in real operations.
Sigma Standard Deviation in Finance

In finance, sigma standard deviation measures investment risk. When stock prices move up and down quickly, variation is high. When prices move steadily, variation is lower. Investors use this measure to compare risk levels. A high sigma standard deviation often means higher uncertainty. A lower value suggests more stable returns. I learned this lesson when reviewing investment reports early in my career. Two funds had similar average returns, but one had far greater variation. The spread told a deeper story than the average alone. It helped guide smarter financial decisions.
Healthcare and Scientific Research
Healthcare professionals use sigma standard deviation to study patient data. For example, doctors may track blood sugar levels. If readings vary widely, it may signal a problem. Small variation suggests stability. In clinical trials, researchers examine how much patient results differ from the average. This helps determine if treatments are reliable. Consistent results build trust in medical findings. I often read research summaries, and I always check how much spread exists in the data. It tells me whether results are dependable or if more study is needed.
Population vs. Sample Standard Deviation
There are two main types of sigma standard deviation: population and sample. Population standard deviation looks at all data points in a group. Sample standard deviation looks at part of the group. For example, measuring every student in a school is population data. Measuring one classroom is a sample. The formulas differ slightly, but the purpose is the same. Both measure spread. In real-world research, samples are more common because studying everyone is often impossible. Understanding this difference improves accuracy and prevents confusion when reading reports.
Common Mistakes to Avoid
Many people misunderstand sigma standard deviation. One mistake is ignoring outliers. Outliers are extreme values that sit far from the average. They can greatly change the spread. Another mistake is assuming all data follows a bell curve. Some data sets do not. It is also important to remember that sigma standard deviation does not explain why variation happens. It only measures how much variation exists. I once made the mistake of trusting the number without checking unusual data points. That experience taught me to always review the full picture.
Technology Makes It Easy
Today, technology makes calculating the sigma standard deviation simple. Tools like spreadsheets and statistical software do the math quickly. You only need to enter your data. Years ago, people calculated it by hand, which took time and patience. Now, anyone can use digital tools to find results instantly. However, the real skill lies in understanding what the number means. Software provides the answer, but interpretation requires thinking. I always remind students that knowing how to read the result matters more than knowing how to calculate it manually.
Why Sigma Standard Deviation Truly Matters
Sigma standard deviation is more than a math formula. It is a tool for understanding patterns. It shows us stability, risk, and consistency. From classrooms to hospitals, from factories to financial markets, this concept helps people make informed decisions. Once you understand spread, you see numbers differently. You stop guessing and start analyzing. I encourage you to look at data in your daily life. Notice patterns in spending, exercise, or performance. When you measure spread, you gain insight. That is the true power of sigma standard deviation.
Conclusion: Why Sigma Standard Deviation Is Worth Understanding
Sigma standard deviation may sound technical at first, but its purpose is simple and powerful. It helps us understand how spread out the numbers are. It shows whether results are steady or unpredictable. That insight matters in school, business, finance, healthcare, and even daily habits. When you understand variation, you make smarter decisions. You see patterns others may miss. You also avoid relying only on averages, which can hide important details. In my experience, learning sigma standard deviation changed how I look at data forever. I encourage you to start noticing the spread in the numbers around you. Practice with small examples. The more you apply it, the clearer and more useful it becomes.
Also read: Dubliner Cheese